Saturday, November 20, 2010

Chapter 12: The Great Plains and Prairies

Santa Clarita was only fairly recently incorporated (1987), but its history runs deep. About AD 450, the Tataviam people arrived, numbering about 2,000 at their zenith. 
The Tataviam (Tataviam: people facing the sun), previously called the Alliklik (Chumash: grunter or stammerer),[1] are a Native American group in southern California. They traditionally occupied an area lying primarily in the upper basin of the Santa Clara River, the Santa Susana Mountains, and the Sierra Pelona Mountains.


In 1842, six years before the better-publicized discovery in the Sacramento area, Francisco Lopez made the first documented discovery of gold in California (the document is a mining claim signed by Gov. Juan B. Alvarado in that year). The discovery was made in Placerita Canyon, an area later used as Hollywood's original back lot.

On September 26, 1876, Charles Alexander Mentry brought in the state's first productive oil well at Mentryville, giving rise to the California oil industry. The oil was brought to a refinery at Newhall; today it is the oldest existing refinery in the world. (It was operational from 1874 to 1888.)

The Santa Clarita Valley was the scene of the second worst disaster in California history — The History Channel called it the "worst civil engineering failure of the 20th century" — when, on the night of March 12, 1928, William Mulholland's St. Francis Dam collapsed. By the time the floodwaters reached the Pacific Ocean near Ventura, an estimated 450 people were dead. Within modern Santa Clarita city limits, the site of the future Westfield Valencia Town Center mall was buried beneath muck and mud. Numerous buildings within Santa Clarita became makeshift morgues.

http://en.wikipedia.org/wiki/Santa_Clarita,_California

Santa Clarita, CA Weather


Santa Clarita, CA climate is warm during summer when temperatures tend to be in the 70's and cool during winter when temperatures tend to be in the 50's.
The warmest month of the year is August with an average maximum temperature of 95.40 degrees Fahrenheit, while the coldest month of the year is December with an average minimum temperature of 35.80 degrees Fahrenheit.
Temperature variations between night and day tend to be big during summer with a difference that can reach 40 degrees Fahrenheit, and moderate during winter with an average difference of 28 degrees Fahrenheit.
The annual average precipitation at Santa Clarita is 17.96 Inches. Winter months tend to be wetter than summer months. The wettest month of the year is February with an average rainfall of 4.32 Inches.

Tornadoes


are common on the Great Plains than in any other area of the world.  Torando warning sirens are a normal part of spring and early summer in communites in Torando Alley between northwest Texas and northeast Kansas.

The latest recording of a Tornado in California was on January 19, 2010.

Much of Southern California was placed on a tornado warning on January 19, 2010. A warning was issued for Los Angeles County around 12:30 pm by the National Weather Service and Orange County was also placed under a warning after 1:00.

While there have been no reports of major injuries or severe damage, witnesses reported seeing a tornado touchdown in Sunset Beach, causing boats in the harbor to be lifted into the air. Jim Amormino, spokesman for the Orange County Sheriff's Department stated that flooding and loose boats were reported in both Sunset Beach and Huntington Harbor.

The tornado warning was issued due to a severe thunderstorm that caused lightning, gusty winds and heavy rain throughout the area. Officials are unsure if an actual tornado formed during the storm, but did report rotating winds.
http://www.cbsnews.com/stories/2010/01/19/national/main6117105.shtml.

On March 8, 2010, President Obama issued a federal disaster declaration for the areas affected by the storm.
http://www.mahalo.com/southern-california-tornado-2010


WHEAT:


California farmers expand wheat acreage to ‘cash in’ on historic wheat prices

Jan. 30, 2008 4:00pm
“Cha-ching.” That magical sound from farm cash registers is the goal of California wheat growers hoping to cash in on historic wheat prices through expanded 2008 wheat plantings.

Wheat prices were strong in fall 2007 and have shifted even higher. Recent California central valley hard red winter wheat contract prices were $235 to $245 per ton, hard white wheat at $285 to $315 per ton, and Desert Durum at $340 per ton, according to Seth Hoyt, senior agricultural economist with the California Agricultural Statistics Service, Sacramento, Calif.
“Wheat will be a fun crop to grow in California this year because of higher prices,” said Bonnie Fernandez, executive director of the California Wheat Commission (CWC).
“Wheat acreage is definitely higher in California. To be cautious, I’d say acreage is increasing 10 percent. To be a little less than cautious, acreage may be 15 percent higher.”
Desert Durum wheat plantings in the Imperial Valley could more than double in 2008 to 110,000 acres, compared to 52,500 acres in 2007, Fernandez said. Wheat acreage also increased in the Sacramento and San Joaquin valleys but not as much.
In 2007, California wheat acreage totaled about 608,000 acres compared to 495,300 acres in 2006. The whopping 23 percent jump was also tied to higher wheat prices.
In the past, California was revered as a two-wheat variety state. However problems with stripe rust encouraged the development of more resistant varieties.
“In 2008, the most popular planted wheat varieties will likely include: hard white – Blanca Fuerte and Blanca Grande; hard red – Joaquin, Expresso, Dash 12, Cal Rojo, and Summit; and Durum – Kronos, Orita, and Platinum,” Fernandez said.
The CWC plans to release the results of its survey on actual acreage by county variety in April.
Annual California wheat planting kicks off in the Sacramento Valley in November, followed by the San Joaquin Valley in December, and wraps up in January in the Imperial Valley. Harvest occurs in the reverse order.
“So far the quality of the 2008 crop looks quite good,” Fernandez said in early January. “Driving around various communities the wheat stands are starting to fill and there’s still quite a bit of wheat being planted.”
Plantings are extending beyond normal planting dates as some growers penciled in an extra 50 to 100 acres to take advantage of higher prices. Meanwhile growers who haven’t grown wheat in crop rotations for 10 to 15 years are coming back into the fold - again encouraged by prices.
“They’re saying I’d hate to miss this year. Maybe if I’m going to rotate with wheat then I’ll rotate a few more acres into it,” Fernandez said.
Even with more disease resistant varieties available, Fernandez encourages growers to practice active management of the 2008 wheat crop.
“If a grower hasn’t grown wheat for years, they need to realize that some disease risks remain,” Fernandez said. “Get out, look at the fields, and walk the fields. If you see something, call your farm advisor or whoever provides disease advice and act quickly. Small amounts of stripe rust can be found one day and left untreated can result in large amounts found just a week later. Early detection is the key.”
Reduced water availability in some California areas is also piquing more wheat interest as farmers shift toward less water-intensive crops.
“In some areas, growers will place water allotments on permanent crops and whatever they have left over might go to a less water-intensive crop like wheat,” Fernandez said.
Some speculation has surfaced that hard white wheat seed might be in short supply for the 2008 season. Fernandez doesn’t think that will happen.
Optimal rains in the Sacramento Valley aided wheat plantings, while rainfall totals at press time were less in the San Joaquin Valley. An approaching weekend storm was expected to drop moisture across much of the state.
For some dryland wheat growers, 2008 planting efforts have fared better than for the 2007 crop. “Some growers are reporting success in getting wheat in the ground while they couldn’t last year due to the lack of moisture,” Fernandez said.
The bottom line — price is the steering wheel that’s driving expanded California wheat acreage.
“With wheat it’s about the price. However, growers in California and across the U.S. have other good grain options (price wise), plus other crops,” Fernandez said. “With wheat, it’s very hard not to plant a crop that’s not difficult to grow in such a high (price) market.”
Most wheat in California is grown in a rotation with other crops. The average California wheat farm acreage is 700 to 800 acres, Fernandez said.
According to the CWC’s 2007 California Wheat Variety Survey, hard red wheat was the predominant class of wheat grown in the state, although the most commonly planted wheat variety, Blanca Grande, is a hard white wheat variety planted mostly in the San Joaquin Valley.
About 24 percent of all non-durum wheat planted was the Blanca Grande variety, followed by the hay/forage red wheat variety PR 1404. The variety Summit was a close third with approximately 79,000 acres planted, according to survey results.
In the Imperial Valley, the Desert Durum varieties Kronos and Orita were the top planted varieties in 2007. Other predominant varieties included the newer varieties Desert King and Havasu.
In the San Joaquin Valley, the durum variety Platinum was the most planted. The introductory variety RSI 64 was the second most planted variety.

http://westernfarmpress.com/california-farmers-expand-wheat-acreage-cash-historic-wheat-prices

Santa Clarita Water

Santa Clarita Valley Water Conservation Campaign
The City is responsible for managing more than 35 individual zones in the Landscape Maintenance Districts and more than 700 acres of landscaped medians throughout the City. Santa Clarita is always seeking ways to use technology and other approaches to limit the amount of water we use. This link highlights just a few of the existing and planned new ways that the City will works towards reducing its water usage.

WaterSenseWaterSense, a partnership program sponsored by the U.S. Environmental Protection Agency, makes it easy for Americans to save water and protect the environment. Explore this site to learn about water-efficient products, saving water, and how businesses and organizations can partner with WaterSense.

Valencia Water Company
  • Resource for rebates, water conservation programs, helpful links, water surveys, etc. Click here for more information
Newhall County Water District
  • Discover different ways to become more water efficient, with information, articles and tips related to water conservation. Click here for more information.
Castaic Lake Water Agency
  • Castaic Lake Water Agency is asking all customers to rethink water consumption and to reduce water usage by 10 percent.  Click here for some easy ways you can conserve.
http://www.santa-clarita.com/index.aspx?page=660


Your City and County: Planning for the future of the Santa Clarita Valley

By Paul Brotzman, Director, Community Development
To insure that the City of Santa Clarita and Los Angeles County have logical and realistic plans for the delivery of public services within the Santa Clarita Valley, both the City and County have been working together with residents, businesses and property owners to develop new General Plans that will address long term streets and highway needs, sewer and water requirements, public safety requirements, housing needs and future land use patterns.

Does this planning effort encourage or promote growth? The answer is no. It provides for processes and controls to ensure that both the City and County can reasonably manage growth as it occurs within the Santa Clarita Valley. Does OVOV provide for greater growth than the current General Plans of the City and the County? Again, the answer is no. It does modify some existing proposed growth patterns but it reduces the amount of overall development that will be permitted to occur within our Valley.

Both the City and County recognize that the vast majority of development that has and will continue to take place in the Santa Clarita Valley is located in the much larger unincorporated areas of our Valley that surround the City of Santa Clarita. With this in mind, the City and County have worked closely to plan for logical growth that limits leapfrog development, reduces urban sprawl and insures that the infrastructure will be adequate to accommodate development within the unincorporated areas and infill development that will gradually occur within the City.

One Valley One Vision's key goals include: preserving open space and creating a greenbelt around the valley; strategically building on our town center; and creating more jobs through out the Valley in order to reduce traffic congestion and provide economic opportunities here at home. These goals are interconnected and each plays a part in creating a robust future for our City and for the Santa Clarita Valley.

Residents, business owners, students, and elected officials have been involved with the OVOV process from the beginning. In fact, OVOV has had more community outreach and public participation than any other project in our City's history. Each element of the new General Plan (an "element" is a specific section of the plan that deals with topics like safety, circulation, noise, etc.) have been prepared in draft form and presented during Planning Commission study sessions and open to the public. This information, along with comments and suggestions from local residents, has shaped the draft OVOV General Plan. Residents have had real impacts: potential zoning and land-use designations have been scrutinized, and in some cases, changed due to the direct recommendations of concerned, informed community members.

It is important to note that State law requires General Plans to be updated periodically. OVOV is the City's first overall update since the original General Plan was adopted in 1991. Much has changed in our valley in the past 20 years. Our community has grown, schools and roads have been built, and our economy has experienced tremendous shifts. The new General Plan reflects these changes and will provide a blueprint that will guide the future of our valley for the next 20 years. Now, more than ever, it is important to preserve and in some cases enhance the community character of individual neighborhoods, plan to protect our open space and environment, and conserve resources while at the same time encouraging economic development and providing much needed housing for the City's current residents.

Santa Clarita is part of a vibrant, growing region and growth will continue to occur in our community. When One Valley One Vision is adopted, residents have told us they want more jobs, preserved neighborhoods and a vibrant town center, all in appropriate areas. Residents have also told us that any new development should compliment and enhance the character of their neighborhood or community. Under the City/County One Valley One Vision, anticipated population growth in the Santa Clarita Valley will be less what the current City and County plans allow. At the end of this unique visioning process, City and County development standards will be nearly the same for the first time, and both agencies will share a common vision for the Santa Clarita Valley.

Over the next few months, the City and County will be circulating the Draft Environmental Impact Report that will provide more opportunities for public comment on the proposed General Plans. It is anticipated that the City's portion of OVOV will be presented to the Planning Commission in a public hearing in the fall of 2010, with adoption by the City Council anticipated in early 2011. Public comments are welcome! If you would like more information about One Valley One Vision please call Jason Smisko, Senior Planner, at (661) 255-4330 

http://www.santa-clarita.com/ovov/yourcityandcounty.asp

Chapter 11: The Agricultural Core

Santa Clarita, California is very different than the Agricultural Core.  Santa Clarita is a booming region with business as its core.


Source: First American Title Company’s California Economic Forecast, October 2007
BUSINESS ENVIRONMENT
Santa Clarita’s local economy is primarily a service based economy with 41% of the businesses in the service sector. An additional 21% of businesses are in retail trade and 10% each are in the finance, insurance, and real estate sector as well as construction.


The businesses located in Santa Clarita can be categorized as small businesses with 59% employing less than 5 employees. Businesses between 5 and 9 employees account for 19% of all businesses in the City and only 5% employ in excess of 50 employees.


The amount of space Santa Clarita businesses occupy is relatively small. Close to one-half or 46% of businesses are in locations between 2,500 and 9,999 square feet with an additional 36% of businesses occupying less than 2,500 square feet.

 A DIVERSE WORKFORCE
WORKFORCE


Close to two in four or 38% of the workforce in the City of Santa Clarita is employed in the services sector. An additional 25% of the City’s workforce is employed in retail trade followed by 9% in manufacturing, 8% in construction, 7% in finance/insurance, and real estate industries, and 6% in wholesale trade.

More than one-fourth or 26% of the City of Santa Clarita’s workforce are in professional or specialized positions while another 21% are in administrative and support positions, 14% are in marketing or sales, and 11% are in executive roles.

One-third or 32% of Santa Clarita Valley’s manufacturing workforce is employed in aerospace with an additional 18% in computers and electronics and 14% in biomedical manufacturing.

The City of Santa Clarita’s workforce in the services sector is somewhat evenly distributed among education at 16%, consumer at 15%, health at 14%, and entertainment/amusement and business/computer services at 13% each. The remaining 9% are employed in legal/membership/other services.

Based on an independent study of 367 communities across the United States by the Kosmont-Rose Institute, cost ratings were developed in order to compare difference communities based on business taxes, telephone taxes, sales taxes, property taxes, electric taxes, and state income taxes.

Santa Clarita is ranked as Low Cost ($$) compared to the Cities of Los Angeles and Pasadena which are both ranked as Very High Cost ($$$$$). Out of 224 California cities, Santa Clarita is ranked as the 11th lowest cost city in Los Angeles County.


UNEMPLOYMENT

Santa Clarita maintains one of the lowest unemployment rates in Los Angeles County. The City’s unemployment rate was 4.9% in August 2008 compared to 8.2% for Los Angeles County and 7.6% for the State of California.


Source: California Employment Development Department, June 2007

LARGEST EMPLOYERS

COMPANYTYPE OF BUSINESS# OF EMPLOYEES
Six Flags Magic MountainTheme Park3,689
William S. Hart Union School District Public High & Junior High School District2,455
Princess CruisesVacation Cruise line Services2,100
Saugus Union School DistrictPublic Elementary School District2,010
U.S. Postal ServiceUS Postal Service1,790
College of the CanyonsCommunity College1,678
Henry Mayo Newhall Memorial HospitalHealthcare Services1,212
H. R. TextronAerospace Manufacturer845
Newhall School DistrictPublic Elementary School District836
The Master's CollegeChristian Liberal Arts College755
Specialty LaboratoriesMedical Research & Development725
City of Santa ClaritaGovernment Agency695
Arvato ServicesBusiness Services586
California Institute of the ArtsPrivate Art School 500
Aerospace DynamicsAerospace Structural Components 420
Fanfare Media WorksInternational Printing & Publishing407
Advanced BionicsMedical Device Mfg 375

Source: Claritas Site Reports, July 17, 2008

http://econdev.santa-clarita.com/Index.aspx

Santa Clarita has ranch properties that are used for boarding horses,  In addition, there are ranches that are used for filming for the Television and Motion Picture industry.  Santa Clarita is very different than the Agricultural Core of the United States of America. 


The small towns of the Agricultural core derive much of its quiet, steady character from its history of slow or non existant growth.  The towns are often a few blocks long, whereas the communites of Santa Clarita are miles long, heavily populated, and growing. 

Chapter 10 The Southern Coastlands: On the Subrtropical Margin

Santa Clarita, California is very similar to the Southern Coastlands in that one could reach the Pacific Ocean in less than one hour whether traveling north or south.


Long Beach, California is approximately 60 miles south of Santa Clarita and has one of the largest ports in the world.

The Port of Long Beach, also known as Long Beach’s Harbor Department, is the 2nd busiest container port in the United States. It adjoins the separate Port of Los Angeles. Acting as a major gateway for U.S.-Asian trade, the port occupies 3,200 acres (13 km2) of land with 25 miles (40 km) of waterfront in the city of Long Beach, California. The Port of Long Beach is located less than two miles (3 km) southwest of Downtown Long Beach and approximately 25 miles (40 km) south of downtown Los Angeles. The seaport boasts approximately $100 billion dollars in trade and provides more than 316,000 jobs in Southern California. Awarded with the Environmental Management Award in 2007, the Port of Long Beach strives to reduce pollution through environmentally progressive programs and initiatives.


File:Crane BridgeShip.jpg

http://en.wikipedia.org/wiki/Long_Beach,_California


Santa Clarita weather facts:

·                    August is the average warmest month.
·                    The highest recorded temperature was 113°F in 1971.
·                    The average coolest month is January.
·                    The lowest recorded temperature was 15°F in 1968.
·                    The maximum average precipitation occurs in February.


apps1.eere.energy.gov


AGRICULTURE:

Santa Clarita does not grow its own citrus trees.  Approximately 45 miles north is Santa Paula, California which is dubbed the citrus capital of the world.

Santa Paula is a city within Ventura County, California, United States. The population was 28,598 at the 2000 census. It has been dubbed the "Citrus Capital of the World."


Santa Paula's economy is primarily agriculturally based, originally focusing on the growing of oranges and lemons. Recently, however, avocados have also been grown, and an avocado was added to the city's official seal (Calavo Growers, Inc. is headquartered here.) Santa Paula's mediterranean climate combined with an estimated 20 feet (6.1 m) of topsoil have made it one of the best locations for growing citrus.
http://en.wikipedia.org/wiki/Santa_Paula,_California


If you travel approximately 65 miles north you will reach Oxnard, California.

According to the Camarillo General Plan: "The areas studied showed a high percentage of Group I soils, primarily located on the relatively flat Oxnard Plain. The Oxnard Plain, because of these high-quality agricultural soils, coupled with a favorable climate, is considered one of the most fertile areas in the world."
Oxnard has been known for several different crops over the years, including: cucumbers,, sugar beets, lima beans, Stock (the cut flower), and strawberries. In the years of Oxnard's growth during the 70's and 80's, many farms and ranches were annexed for development, and many new development plans threatened much of the plain's farmland. In 1995, a grassroots effort known as SOAR (Save Open Space and Agricultural Resources) was initiated by farmers, ranchers and citizens of Ventura County in an effort to save the vast agricultural asset of the Oxnard Plain.

The Oxnard Plain is well-known for its strawberries. According to the USDA, Oxnard is California’s largest strawberry producer, supplying about one-third of the State's annual strawberry volume. From the end of September through the end of October, strawberries are planted and harvesting occurs from mid-December through mid-July in Oxnard. The peak harvesting season in California runs from April through June, when up to 10 million pint baskets of strawberries are shipped daily.  The state of California supplies over 85 percent of U.S. strawberries, with the U.S. supplying for a quarter of total world production of strawberries.

Each year Oxnard hosts the California Strawberry Festival during the summer at Oxnard College, featuring vendors as well as food items based on the fruit such as strawberry nachos, strawberry pizza, strawberry funnel cake, strawberry sundaes, and strawberry champagne.
http://en.wikipedia.org/wiki/Oxnard,_California

Santa Clarita, California experiences earthquakes not hurricanes.  The Northride Earthquake of 1994 impacted my life considerably in that I was not able to go to work due to collapsed freeways.

The Northridge earthquake occurred on January 17, 1994 at 4:31 AM Pacific Standard Time in Reseda, a neighborhood in the city of Los Angeles, California, lasting for about 45 seconds. This was a holiday Monday - Martin Luther King, Jr. Day. The earthquake had a "strong" moment magnitude of 6.7, but the ground acceleration was one of the highest ever instrumentally recorded in an urban area in North America.  Seventy-two deaths were attributed to the earthquake, with over 9,000 injured. In addition, the earthquake caused an estimated $20 billion in damage, making it one of the costliest natural disasters in U.S. history.


http://en.wikipedia.org/wiki/1994_Northridge_earthquake


The City of Santa Clarita recognizes that Small Businesses greatly contribute to our economic vitality. We want your business to thrive for the well-being of you and your family, your employees and our community. In addition to opportunities to conduct business with the City, Santa Clarita offers a variety of additional resources from training programs to networking groups. This site offers some of the many resources available to you and your business.
http://econdev.santa-clarita.com/Index.aspx?page=5

Saturday, October 16, 2010

Chapter Nine: The Changing South

The Changing South is very different than Santa Clarita, California. 

The population of the Changing South is predominantly African-American.

Santa Clarita's popluation according to the census of 2000, the racial makeup of the city was 59.02% Non-Latino/Non-Hispanic White, 20.50% Hispanic or Latino of any race, 8.54% from other races, 5.24% Asian, 3.89% from two or more races, 2.07% African American, 0.59% Native American, 0.15% Pacific Islander.


The Changing South shifted from agrarian to industrial.  Santa Clarita is predominantly service oriented with 42% of its' businesses serving the community. 

Poverty persists in many areas of the Changing South and Santa Clarita has its' own share of poverty as well.  The Global economy has impacted all of the world and it is no different here in Santa Clarita, California. 

According to a 2007 estimate, the median income for a household in the city was $79,004, and the median income for a family was $91,450. Males had a median income of $53,769 versus $36,835 for females. The per capita income for the city was $26,841. 6.4% of the population and 4.7% of families were below the poverty line. 6.7% of those under the age of 18 and 5.9% of those 65 and older were living below the poverty line.

http://en.wikipedia.org/wiki/Santa_Clarita,_California

History of Slavery in America 
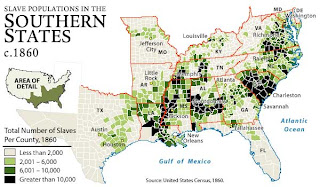
Follow the timeline to learn more about the history of slavery in the United States, including the arrival of the first African slaves to America, the federal banishment of slave importation, and the abolishment of slavery in the United States.
1615
1619 The first African slaves arrive in Virginia.
1620
1785
1787 Slavery is made illegal in the Northwest Territory. The U.S Constitution states that Congress may not ban the slave trade until 1808.
1790
1793 Eli Whitney's invention of the cotton gin greatly increases the demand for slave labor.
1793 A federal fugitive slave law is enacted, providing for the return slaves who had escaped and crossed state lines.
1795
1800
1800 Gabriel Prosser, an enslaved African American blacksmith, organizes a slave revolt intending to march on Richmond, Virginia. The conspiracy is uncovered, and Prosser and a number of the rebels are hanged. Virginia's slave laws are consequently tightened.
1805
1808 Congress bans the importation of slaves from Africa.
1810
1815
1820
1820 The Missouri Compromise bans slavery north of the southern boundary of Missouri.
1822 Denmark Vesey, an enslaved African American carpenter who had purchased his freedom, plans a slave revolt with the intent to lay siege on Charleston, South Carolina. The plot is discovered, and Vesey and 34 coconspirators are hanged.
1831 Nat Turner, an enslaved African American preacher, leads the most significant slave uprising in American history. He and his band of followers launch a short, bloody, rebellion in Southampton County, Virginia. The militia quells the rebellion, and Turner is eventually hanged. As a consequence, Virginia institutes much stricter slave laws.
1831 William Lloyd Garrison begins publishing the Liberator, a weekly paper that advocates the complete abolition of slavery. He becomes one of the most famous figures in the abolitionist movement.
1846 The Wilmot Proviso, introduced by Democratic representative David Wilmot of Pennsylvania, attempts to ban slavery in territory gained in the Mexican War. The proviso is blocked by Southerners, but continues to enflame the debate over slavery.
1849 Harriet Tubman escapes from slavery and becomes one of the most effective and celebrated leaders of the Underground Railroad.
1850 The continuing debate whether territory gained in the Mexican War should be open to slavery is decided in the Compromise of 1850: California is admitted as a free state, Utah and New Mexico territories are left to be decided by popular sovereignty, and the slave trade in Washington, DC is prohibited. It also establishes a much stricter fugitive slave law than the original, passed in 1793.
1852 Harriet Beecher Stowe's novel, Uncle Tom's Cabin is published. It becomes one of the most influential works to stir anti-slavery sentiments.
1854 Congress passes the Kansas-Nebraska Act, establishing the territories of Kansas and Nebraska. The legislation repeals the Missouri Compromise of 1820 and renews tensions between anti- and proslavery factions.
1857 The Dred Scott case holds that Congress does not have the right to ban slavery in states and, furthermore, that slaves are not citizens.
1859 John Brown and 21 followers capture the federal arsenal at Harpers Ferry, Va. (now W. Va.), in an attempt to launch a slave revolt.
1860
1861 The Confederacy is founded when the deep South secedes, and the Civil War begins.
1863 President Lincoln issues the Emancipation Proclamation, declaring "that all persons held as slaves" within the Confederate state "are, and henceforward shall be free."
1865
1865 The Civil War ends. Lincoln is assassinated. The Thirteenth Amendment abolishes slavery throughout the United States. On June 19 slavery in the United States effectively ended when 250,000 slaves in Texas finally received the news that the Civil War had ended two months earlier.
1870
Religion is important in the Changing South and evangelical Protestant religions are predominant.
Santa Clarita is predominantly Christian, however large numbers of all religious beliefs are practiced in Santa Clarita.
This website has a vast listing of places to worship.
http://santaclarita.areaconnect.com/churches.html


Santa Clarita, California (CA) Poverty Rate Data - Information about poor and low income residents


Residents with income below the poverty level in 2007:
Santa Clarita:  8.9%
Whole state:  12.4%


Residents with income below 50% of the poverty level in 2007:
Santa Clarita:  3.2%
Whole state:  5.1%

http://www.city-data.com/poverty/poverty-Santa-Clarita-California.html

Poverty hits high among city suburbs

REPORT: Economic woes strain social services in Antelope, San Fernando valleys.
Updated: 10/06/2010 07:08:23 PM PDT

Once a haven where people moved to pursue the American Dream, the nation's suburbs are experiencing a dramatic spike in poverty among working-age residents, straining social services traditionally geared to the inner-city poor. 
 
A pair of analyses released today by the nonprofit Brookings Institution paint a bleak economic picture for the nation's 100 largest metropolitan areas, where the poverty rate is projected to hit 15 percent in the coming years.
 
More startling, however, was a finding that suburbs - including those in the San Fernando, Santa Clarita and Antelope valleys - are bearing the brunt of the increase.
 
"The (social service) providers in the San Fernando Valley that we spoke to all reported significant increases in people seeking help and many of them said this is a trend that has been going on for some time," said Scott W. Allard, an associate professor at the University of Chicago and co-author of the report titled "Strained Suburbs."
 
"Actually, since the 2001 recession ended, there has been steadily increasing need for many of them. The needs have been more acute in the recent recession, but rising needs in suburban areas of Los Angeles have been a reality for many years."
 
From 1999 to 2009, the number of people living below the federal poverty line ($21,954 for a family of four) swelled by 26 percent nationally, with two-thirds of that growth occurring in the suburbs, according to the second report, "The

Great Recession and Poverty in Metropolitan America."  
In the suburbs of Los Angeles, Long Beach and Santa Ana, the number of impoverished residents increased from 10.5 percent in 2007 to 12 percent last year.
 
Allard attributed the increase in poverty to the collapse of the housing market and resulting recession, along with an influx of immigrants to the suburbs.
 
"The fight against poverty lost considerable ground in the 2000s," said Elizabeth Kneebone, a senior research associate at the institute and author of the second report.
 
"Now, suburban communities with limited experience in helping struggling families are increasingly on the front lines of that fight, as many people who had gained a toehold on the economic ladder in more prosperous years fell behind during the course of this economically turbulent decade."
 
But even as the poverty rate was increasing in the suburbs, the researchers found it decreased in Los Angeles city and countywide.
Using Census Bureau data, Allard found that the number of poor people in Los Angeles County decreased from 1.7 million in 2000 to 1.5 million in 2008 - just as the recession was taking hold. The city of Los Angeles experienced a similar drop in impoverished residents, from 801,050 in 2000 to 697,232 eight years later.
 
However, the High Desert city of Lancaster saw a whopping 64 percent spike in impoverished residents during that time, from 18,239 to 29,837. Santa Clarita saw its poverty numbers increase 28 percent, from 9,552 to 12,205.
 
Brenda Crawford, executive director of the Santa Clarita Valley Food Pantry, said the clientele has soared from about 1,000 in 2002 to 6,500 last year. Most of that increase occurred since 2007.
 
"Even though we are considered an affluent community, there are pockets of poverty all throughout the Santa Clarita Valley," Crawford said.
 
"I'd say more than half of our new clients are people who have lost their jobs, either one or both spouses. A lot of times the pressures of a spouse losing their job is so frustrating that we've seen many cases where the family will break up."
 
As a result, Crawford said many single mothers are coming to the food pantry.
 
"We have single moms who maybe haven't worked for a while or worked part-time and really don't make enough to support their children," Crawford said. "Nevertheless, they are now faced with the responsibility of putting food on the table for the entire family."
Barbara Howell, executive director of the Burbank Temporary Aid Center, said the nonprofit agency has always helped "struggling, working-class people" who are underemployed or under-educated.
 
"We now have a growing number of people who have never had to ask for help before," Howell said. "Some have been our donors and now they are coming to us and are embarrassed that they have to ask."
 
The second report, also based on census data, found that suburban residents accounted for more than 37 percent of the nationwide increase in the number of poor people since 2007.
 
In recent decades, millions of Americans at all income levels moved to the suburbs looking for better schools, better jobs, affordable housing and a sense of stability, Allard said. But many have lost jobs and watched their incomes drop.


Santa Clarita Valley Food Pantry
24133 Railroad Avenue
Newhall, CA 91321

Map

Belinda Crawford, Executive Director
Phone (661) 255-9078             
Fax (661) 255-2331
Hours: Monday through Thursday 9:00 until Noon
Seniors only: 3rd Friday, 9:00 until Noon
Working clients only: 1st Saturday, 10:00 until Noon

Our Mission

The mission of the Santa Clarita Valley Food Pantry is to alleviate hunger throughout the Santa Clarita Valley. We accomplish this with a dynamic group of volunteers who source donations, package nutritious food to stretch a family's food supply and distribute that food to qualifying residents in the Santa Clarita Valley.
Watch more about our work.

Our Vision

The Santa Clarita Valley Food Pantry exists to:
  • meet the current and future hunger needs of our neighbors in need
  • ensure client self-sufficiency through active partnerships with other Santa Clarita organizations

With poverty comes lack of education, and lack of medical care. Poverty is in Santa Clarita and in the Changing South. 

National Black HIV/AIDS Awareness Day

AIDS / HIV Blog
By Mark Cichocki, R.N., AIDS / HIV Guide

Saturday February 6, 2010
December 7, 2010 is National Black HIV/AIDS Awareness Day. African Americans are disproportionately affected by HIV/AIDS. While making up only 13 percent of the U.S. population, they account for more than 49 percent of AIDS cases. AIDS is now the leading cause of death for African American women ages 25 to 34, and the second leading cause of death for African American men ages 35 to 44. This year marks the tenth year of National Black HIV/AIDS Awareness Day. Organizations celebrate the day in hopes of raising awareness of the problem of HIV/AIDS in the African American community.


http://aids.about.com/b/2010/02/06/national-black-hivaids-awareness-day.html


The Changing South has Hurricanes while Santa Clarita has Earthquakes.  Hurricane Katrina was the most destructive hurricane to ever strike the United States.


HURRICANE KATRINA — MOST DESTRUCTIVE HURRICANE EVER TO STRIKE THE U.S.
NOAA satellite image of Hurricane Katrina taken on Aug. 28, 2005.On August 28, 2005, Hurricane Katrina was in the Gulf of Mexico where it powered up to a Category 5 storm on the Saffir-Simpson hurricane scale packing winds estimated at 175 mph.
At 7:10 a.m. EDT on August 29, Hurricane Katrina made landfall in southern Plaquemines Parish Louisiana, just south of Buras, as a Category 3 hurricane. Maximum winds were estimated near 125 mph to the east of the center.
Although Katrina will be recorded as the most destructive storm in terms of economic losses, it did not exceed the human losses in storms such as the Galveston Hurricane of 1900, which killed as many as 6,000-12,000 people, and led to almost complete destruction of coastal Galveston. (Click image on left for high resolution version.)
Hurricane Andrew, in 1992, cost approximately $21 billion in insured losses (in today's dollars), whereas estimates from the insurance industry as of late August 2006, have reached approximately $60 billion in insured losses (including flood damage) from Katrina. The storm could cost the Gulf Coast states as much as an estimated $125 billion.

Hundreds of NOAA employees from many divisions of the agency were involved with Hurricane Katrina, which involved forecasting the storm; surveying and clearing waterways; responding to oil and chemical spills; and testing fisheries.

During the 2005 Atlantic hurricane season, the NOAA P-3 turboprop aircraft flew around and into 11 named storms—including Katrina—accounting for 73 missions, which translates into 480 flight hours. The P-3s also flew into the eyewall of the storms 109 times.

NOAA’s Gulfstream IV jet flew 50 missions, for a total 389 flight hours.
NOAA’s Citation aircraft flew 50 aerial photography missions after Hurricanes Katrina, Ophelia and Rita, which amounted to 105 flight hours and thousands of high resolution photos of the storms’ damage.

http://www.katrina.noaa.gov/

Southeast Climate Change


Florida, Georgia, Alabama, Mississippi, Louisiana, Arkansas, Tennessee, Kentucky, Virginia, North Carolina and South Carolina


Information from the U.S. Global Change Research Program, June, 2009

Heat, Stronger Hurricanes and Drought


The Southeast climate region includes: Louisiana, Arkansas, Mississippi, Alabama, Florida, North Carolina, South Carolina, Virginia, Kentucky, Tennessee and Georgia. The average annual temperature of this region has risen 2° Fahrenheit since 1970, with the strongest temperature increase occurring in the winter months.

Seasonal precipitation is changing dramatically in this region. Fall precipitation over most of the region is up about 30 percent with only a small decrease in South Florida. Summer precipitation has decreased in most areas and during the past three decades there have been several severe droughts. Across the region the amount of precipitation that falls in the form of a heavy downpour is up.

The increase in average temperature is expected to continue with the greatest increases occurring in summer. The magnitude of rise is expected to be between 4.5° and 9° Fahrenheit. The frequency of very hot days is expected to increase.

Sea level has been rising over the past few decades and this trend is expected to accelerate. The result will be shoreline retreat and inundation of inland areas. Rising sea temperatures are expected to increase the frequency and strength of hurricanes. Stronger storms with higher wind speeds, more intense rainfall and more powerful surges are expected to cause a lot more damage.


Hurricane Intensity & Storm Surge Get Worse


Sea-level rise and the likely increase in hurricane intensity and associated storm surge will be among the most serious consequences of climate change. Low-lying areas, including some communities, will be inundated more frequently – some permanently – by the advancing sea. Current buildings and infrastructure were not designed to withstand the intensity of the projected storm surge, which would cause catastrophic damage. If sea-level rise increases at an accelerated rate (dependent upon ice sheet response to warming) a large portion of the Southeast coastal zone could be threatened.

http://www.katrina.noaa.gov/

Santa Clarita was hit by the Northridge Earthquake on January 17, 1994.  My house shook pretty hard and I had a lot of broken dishes. It was devastating knowing that the roads and highways collapsed and most residents were not able to go to work including me.  I used the metrolink for three months.  Santa Clarita is approximately 20 miles north of Northridge, California.


The January 17, 1994 Northridge, CA Earthquake
An EQE Summary Report, March 1994 Map of the epicentral area.

Executive Summary


Introduction
At 4:31 A.M., Pacific Standard Time, on Monday, January 17, a moderate but very damaging earthquake with a moment magnitude (Mw) of 6.7 struck the densely populated San Fernando Valley, in northern Los Angeles. This region has been repeatedlyrocked by moderate to large earthquakes throughout recorded history. Thousands of aftershocks, many in the magnitude 4.0 to 5.0 range, occurred during the next few weeks, further damaging already-affected structures.
The death toll was 57, and more than 1,500 people were seriously injured. A few days after the earthquake, 9,000 homes and businesses were still without electricity; 20,000 were without gas; and more than 48,500 had little or no water. About 12,500 structures were moderately to severely damaged, leaving thousands of people temporarily homeless. Of the 66,546 buildings inspected, 6% were severely damaged (red tagged) and 17% were moderately damaged (yellow tagged). In addition, damage to several major freeways serving Los Angeles choked the traffic system in the days following the earthquake. Major freeway damage occurred up to 32 km from the epicenter. Collapses and other severe damage forced closure of portions of 11 major roads to downtown Los Angeles.
  • exec4.gif (35172 bytes)
    One of two new, precast concrete garages that collapsed at Northridge Fashion Center.
Most damage was caused by shaking, but ground failure and several dozen fires triggered by the earthquake also caused substantial damage. There were extremely strong ground motions--among the strongest ever recorded. This strong shaking and the epicenter's location within the densely built-up San Fernando Valley were major contributors to the large losses.
This earthquake occurred in one of the most well-prepared regions of the United States. Most of the structures in the affected area were built during the past three decades and were considered to be reasonably earthquake resistant. The percentage of buildings totally destroyed by the strong ground motion was very small, and most of the serious damage occurred within about 16 km of the epicentral area.
  •  exec5a.gif (40933 bytes)      exec5b.gif (25125 bytes) Left: The badly damaged tower of a new parking garage stair structure. Right: Office buildings in the epicentral area had extensive damage to interior fixtures and furnishings.
Because the earthquake occurred in the early morning and on a holiday, its effects were dramatically reduced from what they could have been. Any of several building collapses each could have caused hundreds of fatalities at a different time of day. Business losses were also moderated by the timing of the earthquake, as most manufacturing and service industries were closed down, and on-the-job injuries were minimized. Further, many businesses had strengthened older buildings before the earthquake, dramatically reducing the potential losses.
This was the third very destructive earthquake to occur in California in the last 23 years. The first was the Mw 6.6 San Fernando (Sylmar) Earthquake, affecting the same area in 1971; the second was the Mw 6.9 (Richter magnitude 7.1), 1989 Loma Prieta Earthquake south of San Francisco. The 1994 event is the most damaging earthquake to strike the United States since the San Francisco Earthquake of 1906. In terms of financial loss, the earthquake is also one of the worst natural disasters in U.S. history, comparable to Hurricane Andrew in 1992.
Geography and Seismicity
Northridge is about 32 km northwest of downtown Los Angeles and is within the suburban San Fernando Valley, which is a sprawling region of residential neighborhoods, apartment complexes, low-rise business and industrial parks, and shopping malls. The area's biggest and best-known geologic fault, the San Andreas, passes about 100 km to the east and north of the San Fernando Valley.
The earthquake occurred on a thrust fault along the northern fringes of the valley. The near-record strong ground motion generated by the earthquake was an indication of the significant risk presented by thrust-fault events of moderate magnitude. Accelerations in the range of 1.0g were recorded over a large area. Similar accelerations, including large vertical accelerations, have been recorded in the past, but at isolated locations and in very limited numbers. Numerous detailed EQE investigations have pointed out that such ground motions were typical in the epicentral areas of many past earthquakes, particularly thrust-type earthquakes such as those in San Fernando in 1971, Coalinga in 1983, Chile in 1985, New Zealand in 1987, and Armenia in 1988.
While this is a major earthquake in terms of its damage, there is no indication that its occurrence has reduced the probability for a stronger earthquake in the next 30 years on a major fault in the Los Angeles region. The probabilities remain in the range of 5% to 10% per year that a major earthquake will strike Southern California. It will be most destructive if it strikes on a major fault such as the Newport-Inglewood Fault or on the San Andreas Fault in the vicinity of Riverside.
1971 San Fernando Earthquake and Comparison to 1994 Earthquake
This was the second time in 23 years that this region has been affected by a strong earthquake. On February 9, 1971, a magnitude 6.6 event struck the San Fernando Valley, about 32 km northeast of the epicenter of the 1994 event. The 1971 earthquake caused 58 fatalities and about 2,000 injuries. At the time, the 1971 earthquake was the most destructive event to affect greater Los Angeles since the magnitude 6.3 Long Beach Earthquake of 1933, and it prompted an extensive reevaluation and update of the building codes. Direct damage to buildings and other structures exceeded $0.5 billion (1971 dollars).
  •     exec7.gif (39659 bytes) A collapsed overpass from the 1971 San Fernando Earthquake. This interchange (Interstate 5 and State Route 14) was also badly damaged in the 1994 Northridge Earthquake.
The San Fernando Valley was a recently developed suburban area in 1971. More than 90% of its houses and other buildings were constructed after the first earthquake design requirements had been incorporated into the local building code in 1933. The greatest number of earthquake-related fatalities occurred in the collapse of several 1920s and 1930s concrete-frame buildings at a hospital.
Building damage in the 1994 Northridge Earthquake was widespread, including collapses of both old and new structures. Damage south of the Hollywood Hills was relatively spotty and was concentrated in older buildings and on softer soils--except in Santa Monica, located directly south of the epicentral area, which had extensive damage. Significant structural damage was reported up to 77 km from the epicenter.
The major difference between the two events was their location. The 1971 shock was centered in the middle of the San Gabriel Mountains and released most of its energy in lightly inhabited areas. It caused strong ground shaking only at the northeastern end of the valley. In contrast, the 1994 event was centered within the San Fernando Valley, with a population of some 3 million. This resulted in far greater damage. The timing of the 1994 earthquake, however, kept the number of fatalities to about the same as in 1971.
  •    exec8.gif (34865 bytes) The roof collapsed in this strip shopping mall concrete tilt-up.
Types of Damage
While many in the earthquake engineering profession were not surprised by the type of damage seen, the general public was shocked by its extent and severity. It is not generally understood that many older buildings have not been strengthened to current code requirements, and that the goal of most current code requirements for new buildings is to prevent loss of life in an earthquake, not to protect the investment in a structure or its contents. Further, there are no requirements for privately owned buildings to be retrofitted to current standards, other than some municipal requirements to improve the earthquake resistance of old unreinforced masonry buildings.
This earthquake also caused extensive destruction of building interiors. Because of the intense shaking and heavy damage to other building elements, sprinkler piping was frequently severed and systems were rendered useless on a much wider scale than has been seen in other earthquakes. Interior partitions, furniture, ceilings, and HVAC and other equipment were destroyed with a thoroughness never before seen on such a scale.
Soft (very flexible) stories, which current building codes attempt to discourage, collapsed and caused loss of life. Concrete-frame buildings and concrete parking structures were seriously damaged, and many collapsed. Steel high rises and other steel buildings generally performed well, although there was significant and widespread damage to a number of steel buildings throughout the area. Concrete tilt-ups, including many office buildings, failed in great numbers.
Retrofit Programs and Code Changes
Probably the most important lesson of this earthquake was that seismic strengthening and risk-reduction programs proved very effective, both in saving lives and in maintaining business operations. Companies that had implemented such programs in the San Fernando Valley can point to some major successes. Several large companies that had strengthened their buildings beforehand had minimal business interruption and avoided substantial losses, potentially totaling in the hundreds of millions of dollars in some cases.
Older concrete-frame buildings frequently present a greater risk than do unreinforced masonry buildings, because they are typically larger and house many more people. To prevent these structures from causing fatalities in the future, it seems reasonable to require retrofitting of such privately owned structures on some prioritized basis, consistent with their occupancy and risk level. A similar program of retrofitting soft-story wood-frame apartment buildings may also be needed. The State of California has already established a retrofit program for its public buildings.
The earthquake caused spectacular collapses and dramatic failures of major modern structures, including new structures. New reinforced concrete garages and many relatively new tilt-up concrete and other buildings collapsed or were severely damaged. The Uniform Building Code, which controls the design of new structures in California, may need major revisions in order to reflect the lessons from this earthquake.
Revisions to the code currently under consideration, if accepted, will for the first time offer options to build for levels of resistance greater than the basic goal of ensuring life safety. Several levels of earthquake resistance may be codified that are intended to give engineers and owners the opportunity to design a structure to ensure usability after an earthquake. In addition to reducing or eliminating business interruption, these higher levels of resistance will also provide an extra margin of life safety.
  •   exec9.gif (44846 bytes) The second story of this concrete-frame building collapsed, bringing the rest of the building down on top of it.
Implications for Other Regions
This earthquake is a warning not only to the rest of California, but to all earthquake regions. The record ground accelerations for a metropolitan region and the damage that they caused in about 15 seconds can occur in or near major cities throughout the world, including all densely populated areas of the Pacific Rim, much of the Mediterranean and Balkans, and much of the Middle East. In the United States, this applies not only to California but to the Pacific Northwest (both of the United States and Canada), the Central Mississippi Valley, the Salt Lake City area, the Charleston area, and other earthquake-prone regions of the country.
A similar earthquake in Seattle, Vancouver, Salt Lake City, or near Saint Louis, for example, would cause far more significant damage to those cities because structures there are typically designed for much lower seismic forces, if any, than are comparable buildings in the San Fernando Valley. In addition, these and other cities adopted seismic-resistive building codes at much later dates. Many buildings, including modern structures and high rises, could collapse.
In metropolitan Tokyo, a similar earthquake would subject a far greater number of buildings than those in the San Fernando Valley to very high accelerations, possibly accelerations well beyond those used by Japanese building codes for new construction. Much of the new construction in Japan is structural steel and is expected to perform reasonably well. However, Tokyo also has tens of thousands of older, reinforced concrete buildings much like the older concrete buildings that collapsed in the San Fernando Valley. Further, much of Tokyo, and particularly much of the industry that encircles the waterfronts along Tokyo Bay, is built on soft soil and fill. Many of these soft soils and landfills will dramatically amplify the ground motion and are likely to fail through liquefaction.
  •   exec10.gif (42754 bytes) A column from the badly damaged Santa Monica Freeway (Interstate 10).
Conclusion
Every earthquake provides us with lessons. The Northridge Earthquake did not yield significant new lessons, and it is encouraging to note that our knowledge of how structures behave in earthquakes is converging rather than diverging. The performance of some steel buildings was the one area that was somewhat surprising, but in general those structures that experienced seismic engineers expected to perform well in fact did perform well. Changes should be forthcoming to future editions of the building code, but they will generally be based on knowledge we have had for some time. The challenge is to convince building owners, developers, architects, and government officials that engineering and construction costs to develop more earthquake-resistant buildings are cost-effective and practical. The long-term benefits are worth the up-front investment. With this earthquake and the Loma Prieta Earthquake, we have examples that show beyond a doubt that investing in retrofits for existing, vulnerable buildings will yield safety and financial benefits.

Thursday, October 14, 2010

Chapter Eight: Appalachia and the Ozarks

     The Appalachia and the Ozarks is very different than Santa Clarita, California.  They cover 300 miles with three physiographic regions, whereas Santa Clarita consists of approximately 10 miles covering four small regions that were incorporated in 1987.  The Appalachians is a relatively poor region, whereas Santa Clarita is mixed with both affluent and poor communities. 


SANTA CLARITA


Santa Clarita is relatively new in comparison, therefore there are many roads and highways that were recently built to accommodate its' every growing population.  


 As was mentioned in earlier chapters, there is no agriculture, or mining that produces substantial revenue in Santa Clarita.  If one travels north along highway 126, there are numerous orange orchards, and strawberry farms. 


The Tennessee Valley Authority supplies electricity accross the Appalachia and Ozark region.

Santa Clarita receives it electricity from Southern California Edison.

Southern California Edison (SCE) is one of the largest electric utilities in California, serving more than 14 million people in a 50,000 square-mile area of central, coastal and Southern California, excluding the City of Los Angeles and certain other cities.
Based in Rosemead, California, the utility has been providing electric service in the region for more than 120 years. SCE's service territory includes more than 180 cities.
Southern California Edison logo

http://www.edison.com/ourcompany/sce.asp


Santa Clarita receives its gas and heating from the Southern California Gas Company.

Southern California Gas Company has been delivering clean, safe and reliable natural gas to its customers for more than 140 years. It is the nation’s largest natural gas distribution utility, providing safe and reliable energy to 20.5 million consumers through 5.7 million meters in more than 500 communities. The company’s service territory encompasses approximately 20,000 square miles in diverse terrain throughout Central and Southern California, from Visalia to the Mexican border.

The Gas Company is a regulated subsidiary of Sempra Energy (NYSE: SRE). Sempra Energy, based in San Diego, is a Fortune 500 energy services holding company.
Map of Service Territory
  • The Gas Company is a regulated subsidiary of Sempra Energy (NYSE: SRE).   Sempra Energy, based in San Diego, is a Fortune 500 energy services holding company.
  • Glad to be of service®
    • Our motto reflects our commitment to provide customers with world-class service. This has been the key to our longevity and success.
    • Everyday we work to improve our systems, develop gas technologies, add convenience, and share useful information to help make it easier for our customers use energy safely and wisely.
    • Our commitment to our customers also includes maintaining a diverse workforce and working with suppliers that represent and reflect the communities we serve.
    • This commitment extends to improving the quality of life in our communities through volunteer activities and charitable contributions. These community programs help to develop thriving neighborhoods and local businesses.
  • Like other investor-owned utilities in the state, Southern California Gas Company’s operations are regulated by the California Public Utilities Commission and other state and federal agencies.
Last Updated, December 1, 2008


SANTA CLARA RIVER


The Santa Clara River flows for 116 miles through northern Los Angeles County and southern Ventura County, in southern California.  With headwaters in the San Gabriel Mountains, the river empties into the Pacific Ocean near the city of Ventura, draining a watershed of approximately 1,600 square miles. 


Many large coastal southern California rivers (e.g. the Los Angeles, Santa Ana, and San Gabriel rivers) have been drastically modified to provide for flood protection and urban development, reducing the influence of natural physical and biological processes that maintain aquatic and riparian habitat.  While the Santa Clara River has been impacted by flood control and water resources infrastructure, urban development and agriculture, the river continues to possess many of the historical attributes of lowland coastal southern California rivers, including a broad, dynamic floodplain, extensive riparian vegetation, and a large coastal lagoon.

The Santa Clara River and its tributaries experience high annual flow variability, multi-year droughts, and extreme seasonal flooding, resulting in a complex matrix of aquatic and riparian habitats that suport a number of endangered and threatened species.  These include the tidewater goby (Eucyclobius newberryi), arroyo toad (Bufo microscaphus californicus), southwestern willow flycatcher (Empidonax trailii extimus), least Bell’s vireo (Vireo bellii pusillus), and slender-horned spineflower (Dodecahema leptoceras).  The Santa Clara River also supports a remnant run of federally endangered southern steelhead (Oncorhynchus mykiss).  The run is much reduced from pre-1950’s levels estimated to have been on the order of about 9,000 adults, making the watershed a focus for regional steelhead recovery efforts.


RADIO

 The Santa Clarita Valley is exclusively served by one radio station: AM-1220 KHTS. The commercial radio station, operated by long time residents and public servants Carl and Jeri-Seratti Goldman, broadcasts from studios located in Canyon Country. The station carries local news, traffic, weather, sports, music and talk shows. The station's transmitter and antennas are located on Sierra Highway between Soledad Canyon Rd. and Sand Canyon Rd. The station has been on the air since October, 2003. Prior to KHTS, AM-1220 was known as KBET until 1999 when the Goldmans sold it to now-Clear Channel Communications, only to buy it back in 2003.
In addition to KHTS, the City of Santa Clarita and its surrounding communities are indirectly served by a number of major market Los Angeles FM and AM radio stations, though residents often complain that radio reception in the valley is poor due to the surrounding hillsides.

Television

 All local programming for Santa Clarita is carried on a single public television channel, which is operated by SCVTV, a tax-exempt 501c3 nonprofit corporation. It is available to Time Warner Cable customers throughout the Santa Clarita Valley on Channel 20 and to AT&T U-verse customers under local programming (Channel 99/Santa Clarita). SCVTV carries public, educational and government programming, including Santa Clarita City Council and Planning Commission meetings, history shows, high school and college news programs, talk shows, football games and other programs of local interest.

There are no commercial over-the-air television stations in the Santa Clarita Valley. The city is part of the Los Angeles media market. Digital signals from the Los Angeles stations are available on local cable television systems, DirecTV and Dish Network.